Cost Engineering
Built Different
We deploy dedicated Cost Labs at manufacturers, running teardown-grade cost analysis on mechanical assemblies, electronic sub-systems, and complete BOMs. Every model is built from first principles on our proprietary platform, xcPEP, and verified against real manufacturing data.
Trusted by global leaders across industries


What we see in 2026
Every product has two BOMs.
One is deeply engineered. The other is a black box.
Commodity parts have drawings, tolerances, and process routes. Cost engineers can model them. But most of that modelling runs on third-party databases with approximate rates and stale indices. The result looks accurate. It is not. Then there is the rest of the BOM. The black box. A motor controller bought as a sealed unit. A hydraulic valve block sourced from a single supplier. A compressor assembly with no manufacturing breakdown. These sit across every BOM, in every industry. For these parts, a teardown-grade cost model almost never exists. Procurement targets annual cost reductions. But without a cost model, the only reference is last year's price. The pattern is identical everywhere we work.
Where we see this
Same pattern. Same gap. Six industries.
This is not a hypothesis. Every engagement confirms it. Here is what the gap looks like in yours.
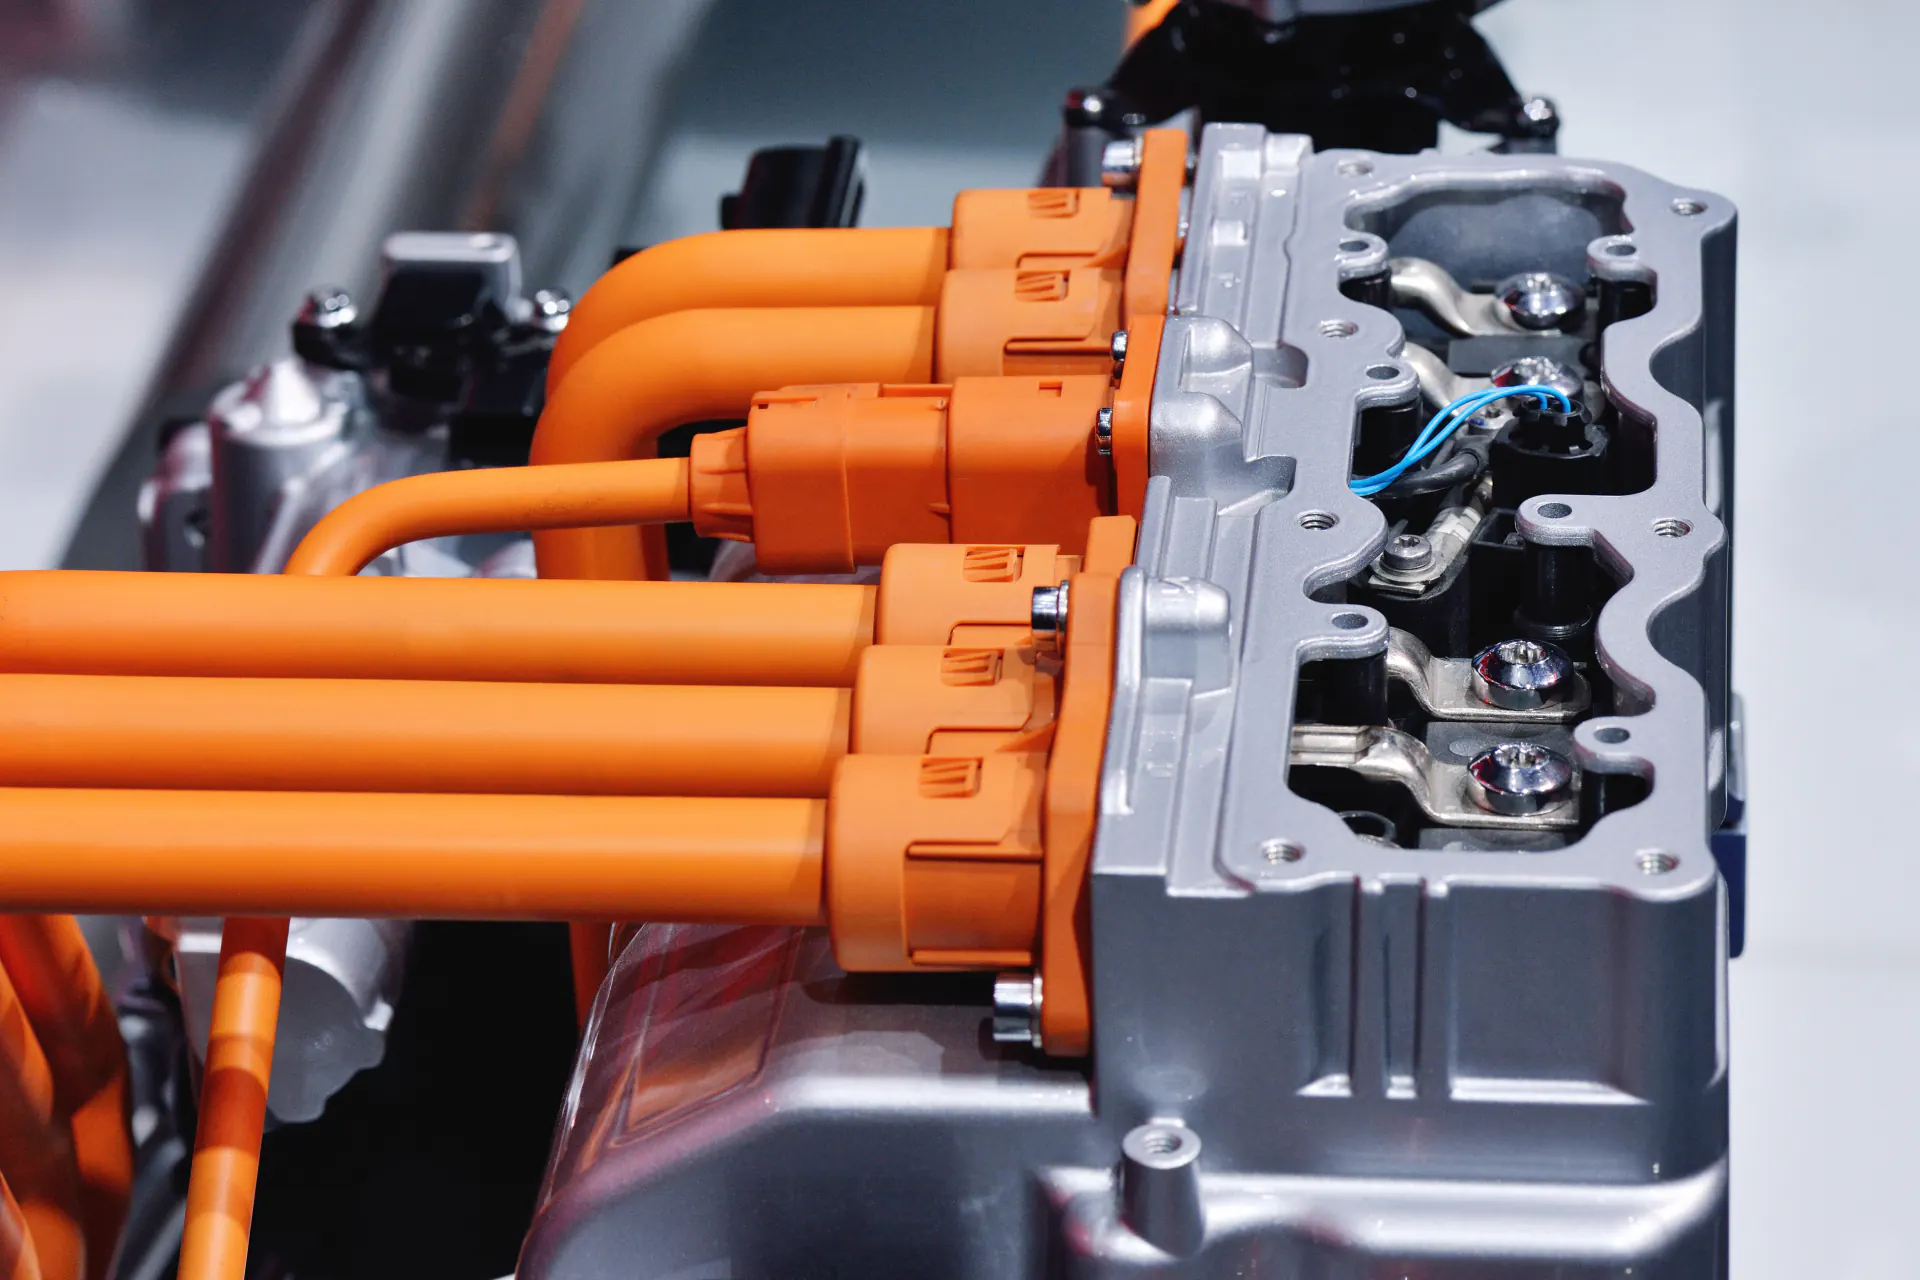 Automotive
Vehicle electronics keep growing. Cost models have not kept up.
Motor controllers, BMS units, ADAS sensors, and infotainment systems are sourced as sealed assemblies. Procurement negotiates without a teardown-grade cost model.
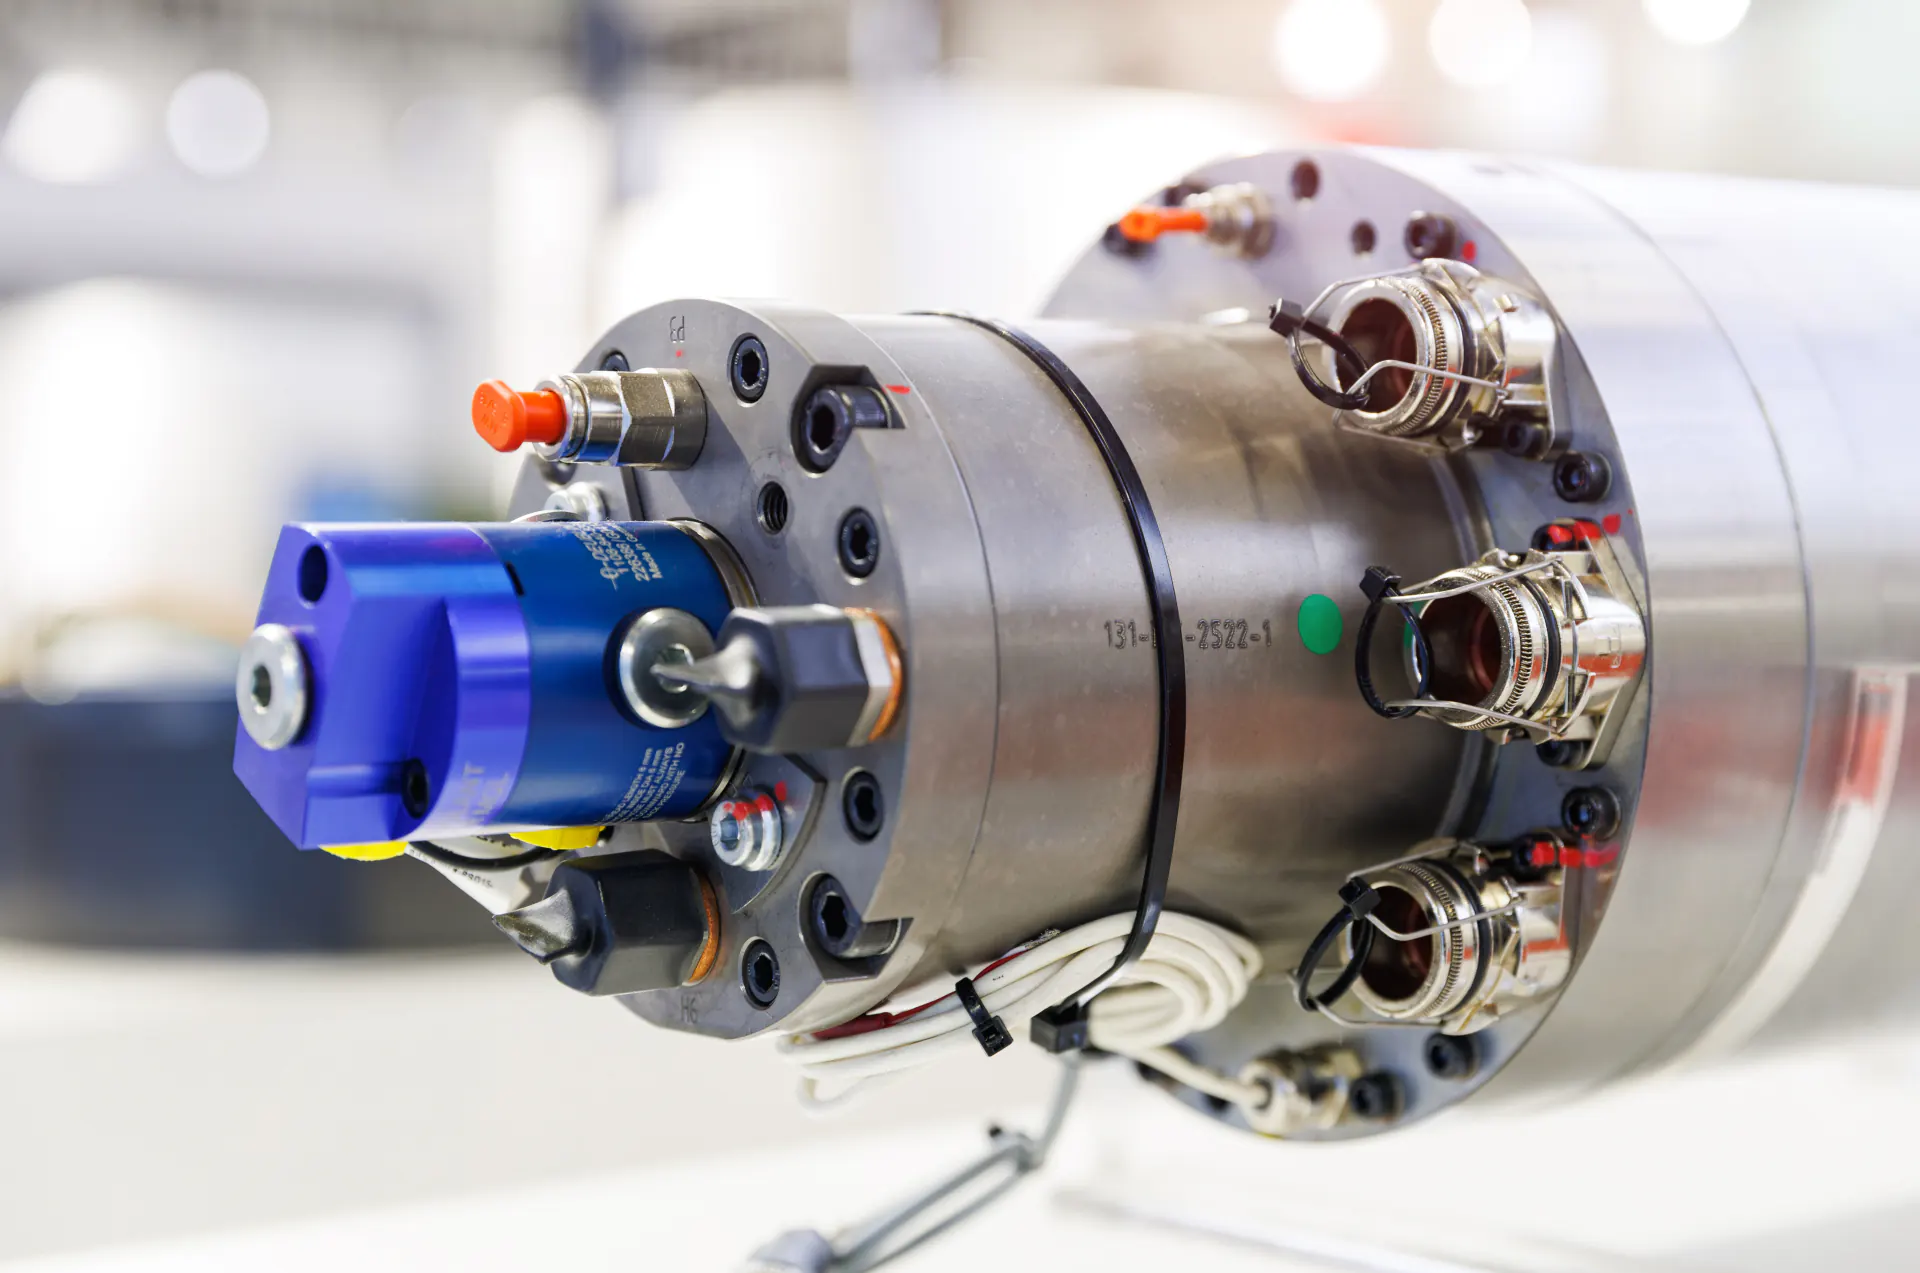
 Off-Highway
Heavy mechanical BOMs. Costed on generic databases.
Castings and hydraulic assemblies drive most of the cost. Teams model them using third-party databases with regional averages that rarely reflect actual foundry economics.
 Industrial Equipment
Long product cycles. Costs escalate without validation.
VFDs, servo drives, and PLCs are priced once and escalated annually. Without periodic teardown and re-modelling, every supplier inflation passes into the BOM unchallenged.
 Consumer Electronics
High-value components sourced as sealed units. Most have never been cost-modelled.
SoCs, display panels, motherboards, battery cells, and multi-layer PCBAs make up most of the product cost. These are sourced as sealed assemblies. Procurement negotiates without a teardown-grade cost model.
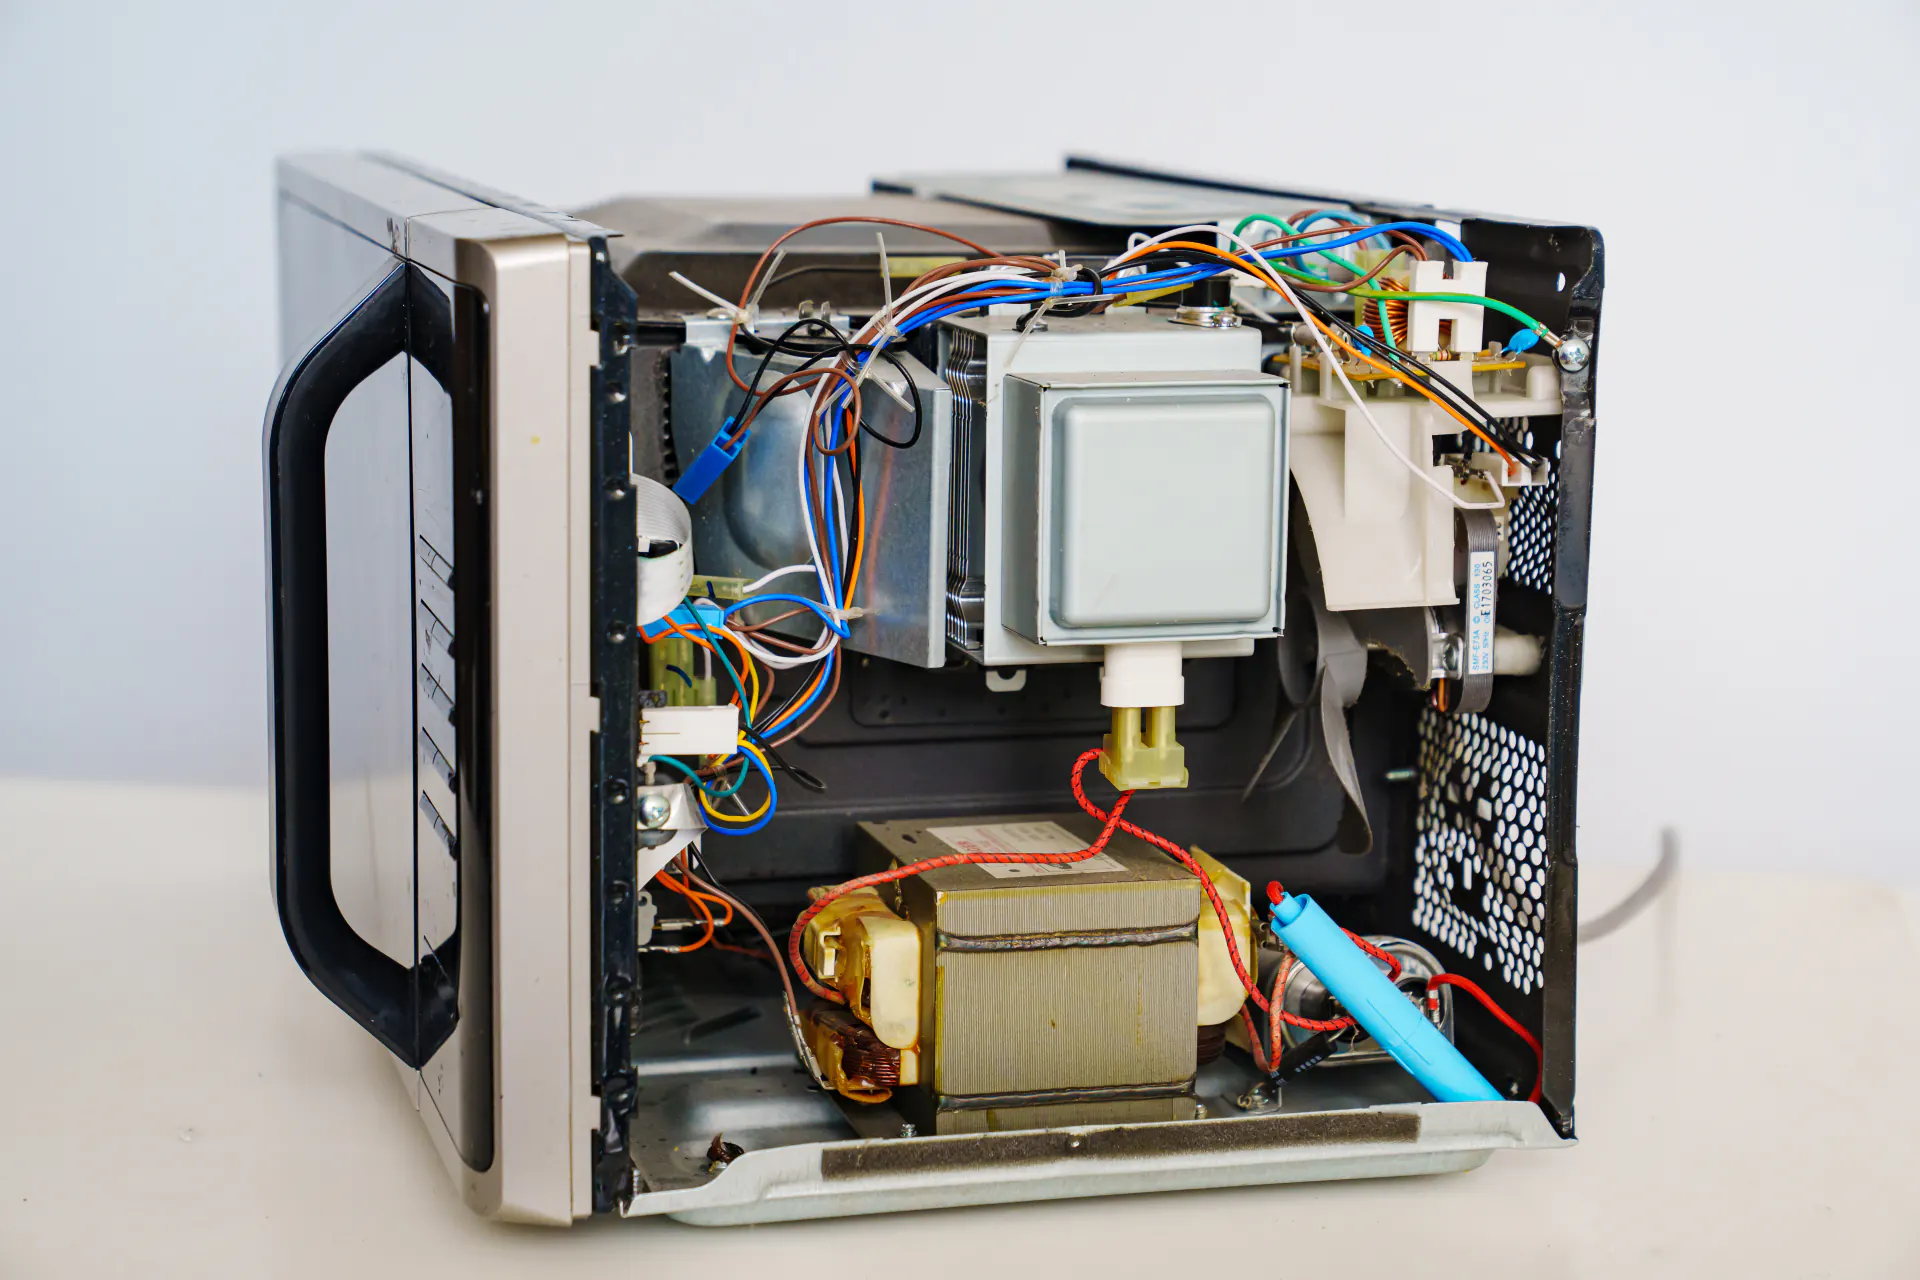 Home Appliances
Mechanical and electronic in one product. Only half is cost-modelled.
Controller PCBs, BLDC motors, and IoT modules now drive the cost difference between models. The mechanical portion is modelled. The electronics portion is sourced as a sealed assembly.
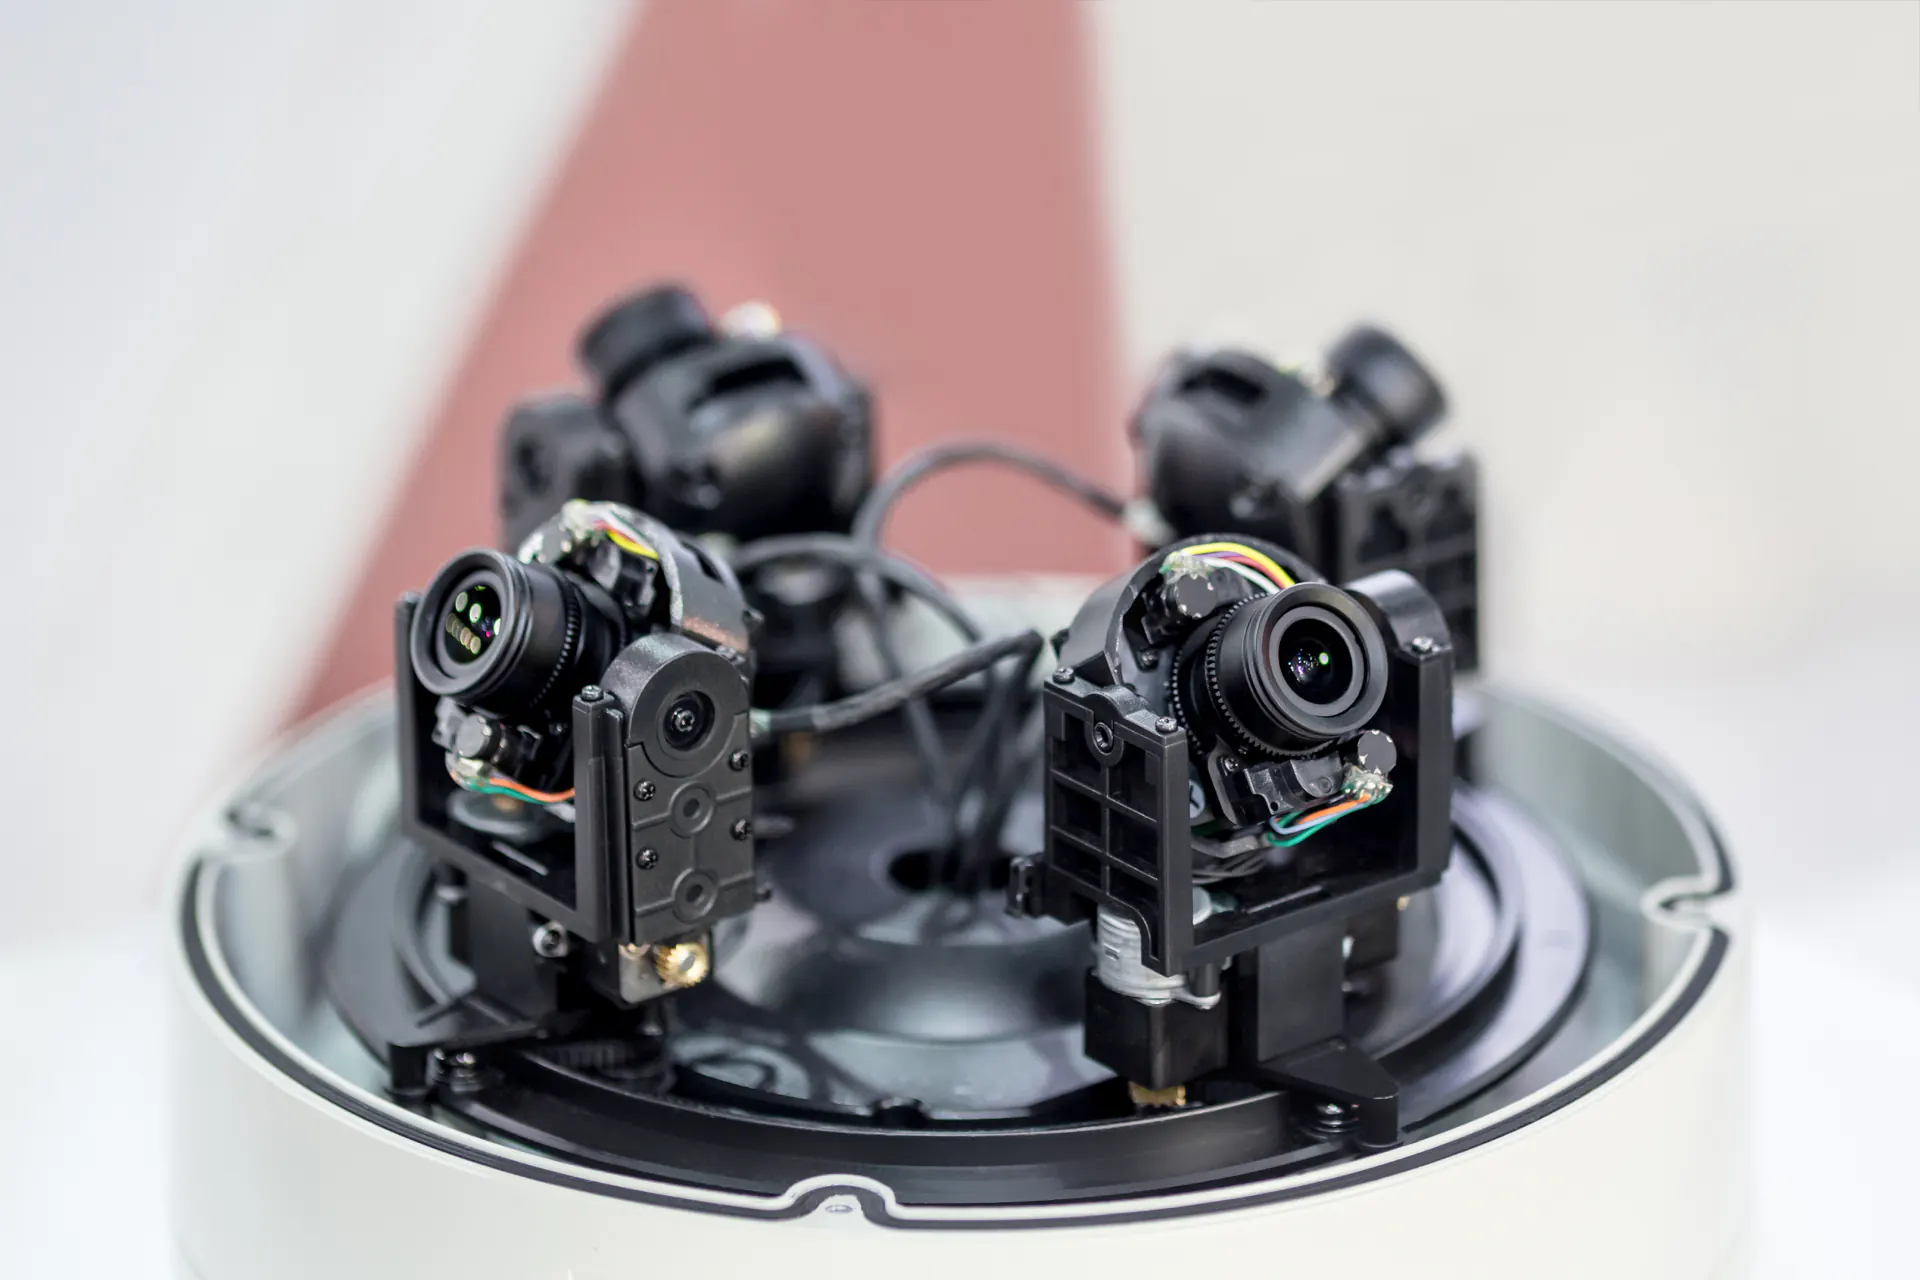
 Medical Devices
Regulated assemblies. Supplier pricing accepted without validation.
Sensor arrays, imaging PCBs, and microcontrollers sit inside regulated assemblies. Teams assume these costs are fixed because the supplier says they are.
Why this hasn't been solved
The data is borrowed. The methods stop short. The baseline was never built.
Cost data is borrowed, not built.
- Mechanical should-cost relies on generic rates and thumb rules
- Sealed assemblies, mechanical or electronic, have no cost model at all
- Supplier quote is never validated against a should-cost
In both cases, the number your team negotiates from was never validated against actual supplier economics. The gap is not a rounding error. It is structural.
VAVE methods don't reach sealed assemblies.
- Traditional VA works on castings, stampings, machined parts
- Cannot reach inside a sealed ECU, transmission, or sourced sub-assembly
- MHR used in forging models rarely reflects actual foundry
Value analysis works on what you can see. It does not reach the sealed assembly, whether that is an ECU, a hydraulic pump, or a compressor. It also does not validate whether the MHR used in a forging model reflects the foundry that actually made it.
Procurement negotiates without should-cost.
- Sourcing sees a quote, not a cost stack
- Only lever is annual cost reduction targets
- Supplier quote was never validated against a should-cost
Without an engineering target, the only lever is annual percentage pressure. The reduction target feels productive. But the supplier's starting price was never validated.
No firm has built the infrastructure.
- Needs cost data that is researched, not generic third-party databases
- Needs physical teardowns and validated process models
- Needs engineers fluent in mechanical and electronics
Proper should-cost needs cost data that is researched, physical teardowns, validated process models, and engineers who understand both mechanical and electronics manufacturing. Generalist consultancies have none of it.
How we do this
We build the capability at your premises. It stays when we leave.
Your engineers. Your products. Our technology, data, and instruments. Four phases from scoping to permanent internal cost engineering capability.
Scope & Map
Onsite meetings with engineering and procurement leadership.
The entire product portfolio gets mapped: annual spend, supplier concentration, and component complexity across mechanical and electronics. The goal is to find where black-box assemblies sit.
Cost Lab & Teardown
A dedicated cost engineering team is deployed at the facility.
Engineers across six disciplines, equipped with 32+ precision instruments and two proprietary data capture systems built in-house. Every selected assembly goes through structured physical teardown to the last component.
Should-Cost Modeling
Teardown data maps into xcPEP, a glass-box should-cost platform.
Cost models get built around how products are actually manufactured: processes, routing logic, quality standards. The data backbone is xcPROC: city-specific and time-specific manufacturing data. All primary-collected.
Sustenance & Transfer
Build-Operate-Transfer.
The capability gets built, co-operated with the client's team until they are fully independent, then ownership transfers permanently. The cost lab, the instruments, the data, the trained team: everything stays.
Product studies & client success
Real teardowns. Published openly. Built on the same stack deployed at your facility.
What stays at your facility
When the engagement ends, three things remain. Permanently.
Physical Products
Your products, competitor assemblies, or supplier parts at any stage of production.
Drawings and CAD
2D engineering drawings, 3D CAD models, or design data from your PLM system.
Legacy Cost Data
Existing Excel cost sheets, internal cost databases, or any structured cost data your organization already maintains.
Strategic Outcomes & Digital Transformation
Sustenance
Everything stays after we leave.
What sits under every cost decision
Rates that were never collected. Models that were never detailed. Every quarter, this foundation compounds.
MHR, LHR, raw material prices, operations cost sourced from third-party databases.
Most cost models use regional averages from external databases. These rates are not collected from the actual city, supplier, or time period. The model structure may be detailed. The rates inside it are not.
Most cost models stop at the top level. The process detail underneath is missing.
A casting modelled with three operations when the actual routing has twelve. An assembly costed as one line item when it contains forty components. Without process-level depth, the model produces a number. It does not produce insight.
Annual cost pressure applied without a validated engineering baseline.
Procurement targets annual cost reductions from suppliers. But the supplier's starting price was never validated against actual manufacturing economics. The reduction target feels productive. The starting point is not.